

















Analysis presentation templates
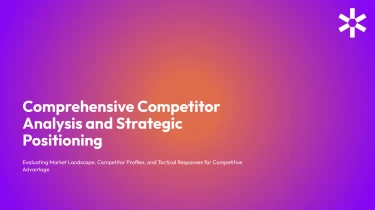
Use AI-powered templates to create analysis presentations
Use text to ppt AI to transform the aforementioned Analysis AI presentation templates into professionally designed slides. When you combine AI with these pre-made layouts, you can arrange your analysis in a logical way without having to manually change things like text boxes, spacing, or slide alignment. So that you can concentrate on the ideas behind your presentation, the templates will give the visual framework and the AI will take care of the formatting.
Turn analytical inputs into structured presentations
Analysis presentations start with information that rarely arrives ready for slides: research notes, performance reports, exported metrics, and unfinished recommendations. Decksy helps turn those inputs into a clear analytical narrative, reducing the time spent sorting content, rebuilding tables, and adjusting layouts when a deadline is approaching.
Start with the material you have
Paste raw text or an outline, upload Word documents or MD files, or provide spreadsheets containing the figures behind your analysis. Your source material gives Decksy the context to organize findings around the question your presentation needs to answer. If your report is already a PDF, explore PDF report conversion to PowerPoint as another starting point.
Build a logical analytical structure
Decksy uses the supplied content to build a presentation structure suited to analysis: context, methodology, key findings, comparisons, and conclusions. An existing outline can guide the sequence, while longer documents provide material for grouping related ideas into focused slides. Main points become slide topics, with supporting details arranged into bullet hierarchies rather than dense paragraphs.
Make data easier to present
Spreadsheet inputs help shape data tables for comparisons, trends, and performance summaries. Instead of manually recreating every row on a slide, you can use the generated structure as a starting point for deciding which figures deserve attention. Tables and supporting bullets give audiences a clearer path from evidence to interpretation.
Review the analysis, not just the formatting
The result is an editable analytical draft built from your inputs, not a blank template waiting for manual assembly. Review the proposed order, check numerical accuracy, and confirm that summaries preserve important qualifications. Then refine the emphasis for your audience, whether you are presenting a market assessment, financial review, or operational report. You stay responsible for the conclusions while Decksy handles the initial organization.
Analysis presentations ready for review, not rework
Analysis only creates value when people can understand it and act on it. After generation, you get a structured presentation that turns findings, comparisons, and recommendations into slides built for discussion. Spend less time fixing layouts and more time checking the story your data tells.
Export a 100% native .pptx file
Your output is a 100% native .pptx presentation, not a collection of flattened slide images. Download a working deck you can share, present, and update as your analysis evolves.
When deadlines are tight, that means fewer formatting tasks between your first draft and your next stakeholder meeting. Use Decksy AI’s text-to-PowerPoint generator to move from written analysis to a presentation you can take forward.
Keep full control in PowerPoint and Google Slides
The deck remains fully editable in PowerPoint and Google Slides. Refine headlines, replace figures, adjust layouts, and apply your team’s visual standards without rebuilding slides from scratch.
Update an assumption before a leadership review. Add context when a stakeholder questions a result. Reuse a slide for a different audience. Your presentation stays a working document, rather than a fixed output that limits what you can change.
Make complex findings easier to follow
Clear hierarchy and focused slides help audiences identify what matters: the trend, the exception, the implication, and the recommended next step. Instead of overwhelming viewers with dense information, organize your analysis around decisions.
That clarity supports audience engagement and leaves more room for useful questions, informed discussion, and alignment.
Protect the information behind your analysis
Enterprise-grade data privacy matters when presentations contain internal metrics, financial forecasts, or strategic plans. Keep privacy central to your workflow, alongside speed and presentation quality.
The value is practical: an editable, presentation-ready foundation that reduces repetitive work while keeping your team in control of the final message.